Pension fund performance:
2021-q4
29 March 2022
On March 10, 2022, De Nederlandsche Bank (DNB) published various key figures of 192 pension funds or collective circles with regard to the fourth quarter of 2021. We provide an overview of the developments.
Number of pension funds
In the fourth quarter of 2021, the number of pension funds and collective circles (excluding funds in liquidation and funds with fewer than 100 participants) decreased from 193 to 192. The following changes have occurred:
- The Eriks company pension fund disappeared in connection with a transfer as of 1 November 2021 to the existing circle B at Centraal Beheer APF.
- The company pension fund Hewlett-Packard disappeared in connection with a transfer as of 1 November 2021 to its own circle at Centraal Beheer APF. This circle is new in DNB’s list.
- The company pension fund TNT Express disappeared in connection with a transfer on 1 December 2021 to the Bedrijfstakpensioenfonds Vervoer.
- At Centraal Beheer APF there are two new circles: circle Enterprise Services Nederland BV (circle ES Nederland) and circle HP Nederland.
- The pensions of Pensioenfonds General Electric Nederland were
1 September 2021 already transferred to its own circle at Stap Algemeen Pensioenfonds (Pensioenkring GE Nederland). The OPF was still mentioned in the DNB list as of September 30, 2021, but not anymore.
Current funding ratio
The data that DNB publishes every quarter contains information about the policy funding ratios (BDG), but not about the current funding ratios (ADG). We have made an indicative trend of the current funding ratios using publicly available data.
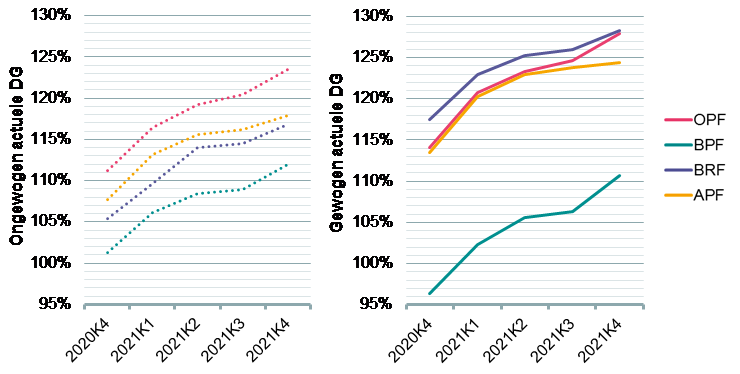
The charts show the average current funding ratios for the quarters 2020Q4 up to and including 2021Q4 for each type of pension fund. The dashed lines are the unweighted averages and the solid lines are the weighted averages. The weighting is based on the invested capital, which means that more weight is given to the larger pension funds. Both figures show that BPFs have on average a lower funding ratio than the other pension funds. The weighted funding ratios (figure on the right) then show that the large BPFs have a lower funding ratio on average than smaller BPFs, while the opposite is true for the other types of pension funds.
The weighted average current funding ratio (measured over all pension funds) rose in the fourth quarter of 2021 from 110.3% to 114.2% (+3.9%).
Policy funding ratio
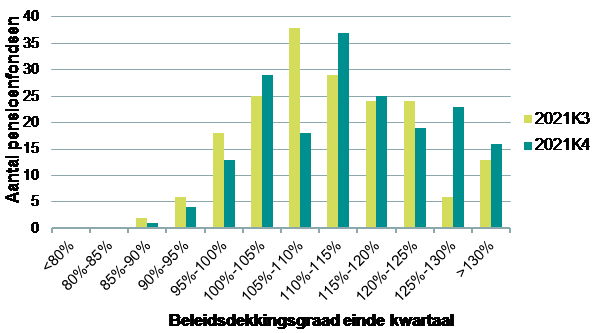
With the exception of one fund, the policy funding ratio (BDG) rose in the fourth quarter of 2021. By the end of the fourth year, most pension funds had quarter of 2021 a GHG between 110% and 115% (37x). Relatively many funds also had a GDP between 100% and 105% (29x). The BDG was lower than 100% at 18 funds. The previous quarter this was still 26. One fund still had a GDP lower than 90%. This fund’s ADG is also below 90%.
The figure below shows the development of the policy funding ratio.
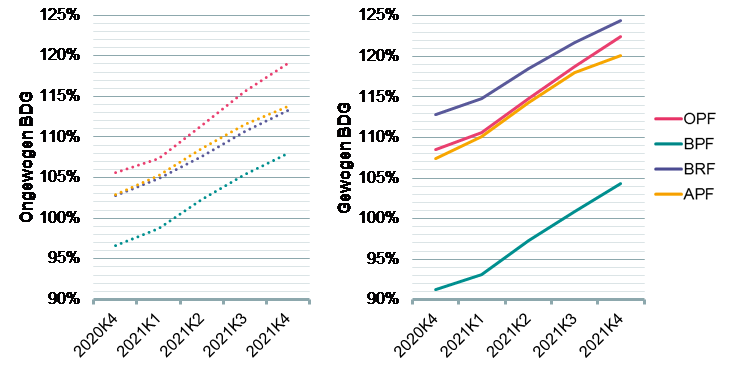
The average (unweighted) BDG increased by 2.8% in the fourth quarter of 2021. The weighted BDG rose slightly more, by 3.4%. For industry pension funds, the weighted BDG is lower than the unweighted funding ratio. This is because the larger BPFs have a lower BDG than the smaller BPFs. The opposite is true for company pension funds, occupational pension funds and general pension funds.

The same figures can be made for the BDG as for the current funding ratio. This shows that the BDG has risen in all four quarters. At 8 funds, the BDG rose by 5%-points or more in the fourth quarter.
Investment returns
In the fourth quarter of 2021, all pension funds showed a positive investment return. The unweighted average investment return for risk fund in the fourth quarter of 2021 was 2.9% positive (2021Q3: 0.3% positive), with a minimum of 0.4% and a maximum of 5.7%. The weighted average return was 3.7% positive (2021Q3: 0.9% positive), meaning that larger pension funds achieved a slightly higher return on average than smaller pension funds. The figure below shows the returns relative to the difference in the current funding ratio.
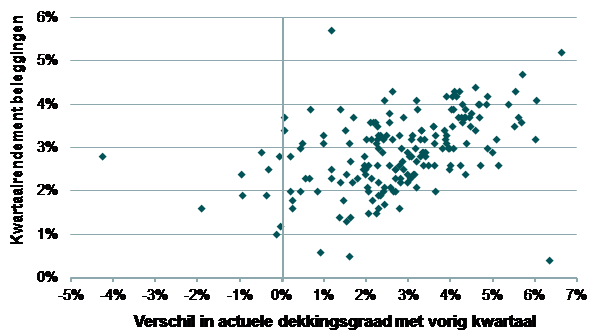
It can be concluded that in the fourth quarter of 2021 the average current funding ratio rose relatively in line with the average realized investment return (4.0% to 3.7%).
Actual Interest Hedge
The following figure shows the extent to which pension funds have hedged the interest rate risk.
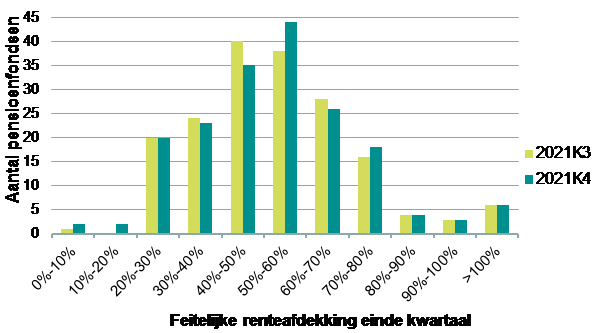
Approximately 69% of the funds have an interest rate hedge of between 30% and 70%. The (unweighted) average interest rate hedge amounts to approximately 53% (2021Q3: 54%). Weighted, the interest rate hedge averages out at approximately 46% (2021Q3: 45%), which means that larger funds generally hedge the interest rate considerably less.
Development of current funding ratio versus marketable securities and interest rate hedging
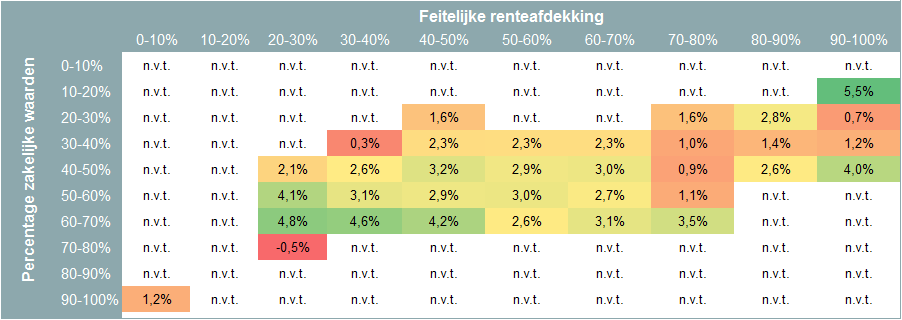
The table below shows the unweighted average development of the current funding ratio in the fourth quarter of 2021 compared to the percentage invested in marketable securities (vertical) and the actual interest rate hedge (horizontal) at the beginning of this quarter. This table shows that a higher percentage invested in commercial securities in the fourth quarter of 2021 resulted in a slightly more positive development of the current funding ratio on average. A higher interest rate hedge sometimes also resulted in a more positive development of the current funding ratio.
